An LRT departure
- A Calgary CTrain on the Red Line leaves Somerset-Bridlewood from rest and reaches 18.0 m/s north in 9.00 s.
- Average velocity uses displacement over elapsed time, and acceleration uses the velocity change over elapsed time.
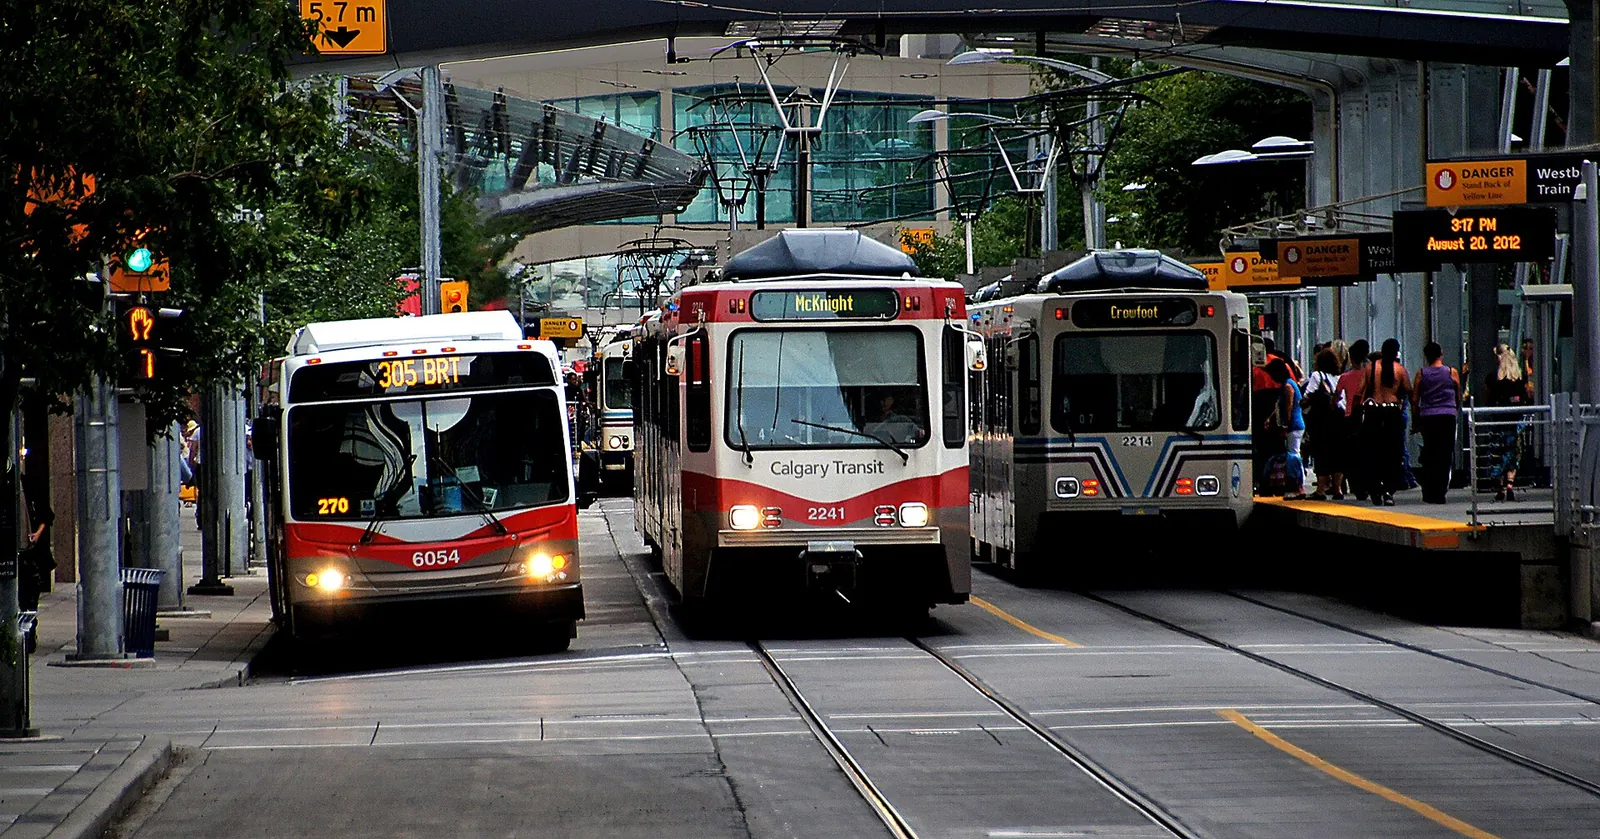
A Calgary CTrain. Leaving a station, a train speeds up at a fairly steady rate for several seconds. That steady speed up is constant acceleration, so its velocity time graph is a straight line sloping upward.
Photo: Calgary Lightrail. C Train by Bernard Spragg, Wikimedia Commons, CC0 1.0